-clo.svg)
On April 2, 2025, dubbed Liberation Day, the VIX jumped from 21.5 in the morning into the mid-40s by the end of the day. Headline volatility coupled with mixed economic and recession fears throughout the month led to interesting trends in the Leveraged Loan market.
Octaura tracks the price movement of over 2,000 facilities, across the liquidity spectrum – from the most liquid credits to the least liquid names. With the activity of 25 dealers now on the platform, Octaura is able to identify unique insights into liquidity and transaction costs. Every loan price mentioned in this analysis is an Octaura EOD loan price unless otherwise noted.
Volatility across the liquidity spectrum
The basis between highly liquid vs. the less liquid baskets has been exceedingly volatile and currently sits at YTD1 wides of $2.23 vs YTD average of $1.56. Defensive positioning continues to drive the basis wider as clients look for security while staying invested.
Interestingly, the basis collapsed to the tightest point on April 4 to $0.69 before pushing to local wides as China announced a 34% tariff on US goods – the S&P 500 dropped 6%, the Nasdaq slid 5.8% and the DJIA fell 2231 points off the back of this news. As recession fears have returned, we observed that clients are selling out of lower rated and less liquid credits and the basis is back to 1.4x the YTD rolling average.
Octaura quantitatively derives Liquidity Scores to enable insight into how an individual name or portfolio of loans can expect to trade. In this analysis, “Highly Liquid” loans refer to those with an Octaura Liquidity Score of 10 or 10+ whereas loans with “Low Liquidity” includes names with an Octaura Liquidity Score of 4-7.

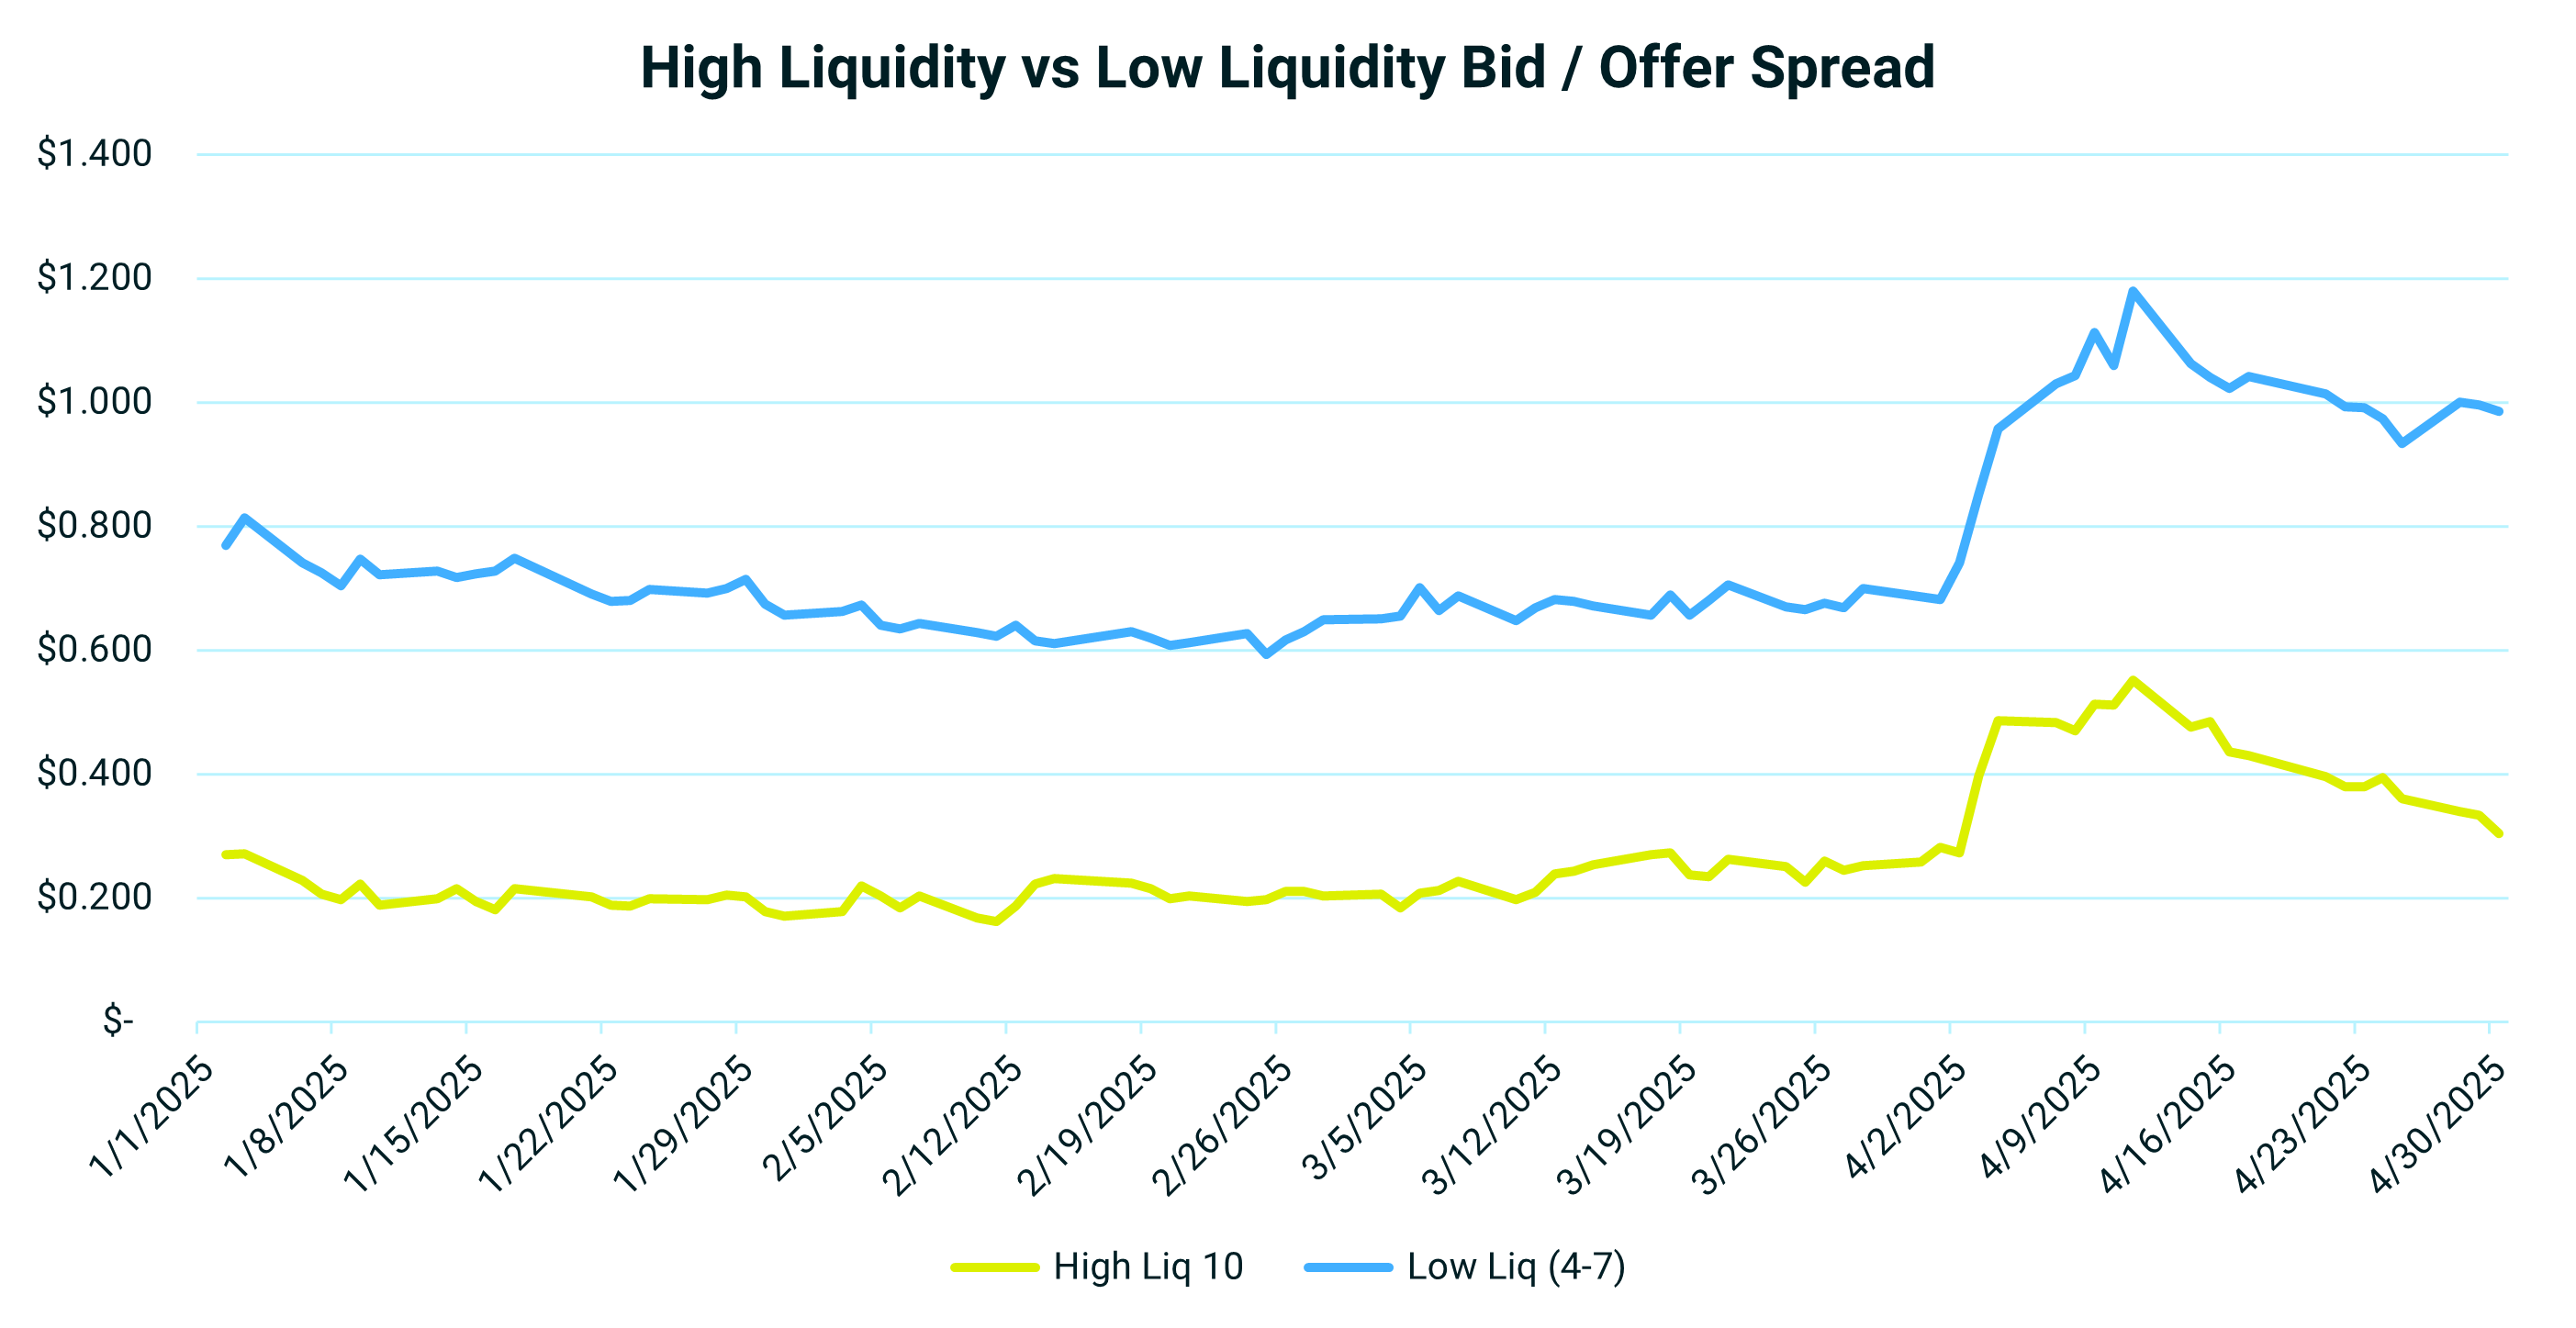
Bid/Offer Spread vs. Liquidity Bucket
With the increase in volatility in April, bid/offer spreads nearly doubled regardless of liquidity bucket as the market priced in risk associated with uncertainty. As of the end of April, spreads are normalizing across the board, though at different rates depending on Liquidity Score. Bid/offer spread for highly liquid names are tightening at a much faster rate, compressing from 2.34x to just 1.29x the average spread vs. lower liquid names, which have tightened from 1.75x to 1.46x the average spread at month end.
1. January 1, 2025 – March 31, 2025
All market prices, data and other information (including that which may be derived from third party sources believed to be reliable) are not warranted as to completeness or accuracy and are subject to change without notice. Octaura disclaims any responsibility for any loss or damage arising from any reliance on or the use of this material in any way. The information contained herein is as of the date and time referenced only, and Octaura does not undertake any obligation to update such information. This marketing material is provided by Octaura for informational purposes only. It is not intended as an offer or solicitation for the purchase or sale of any financial instrument. All investments involve risk, and past performance is not indicative of future results.