-clo.svg)
October brought a wave of volatility to the leveraged loan market. There are a few cross currents across micro and macro trends that offer a confusing market picture:
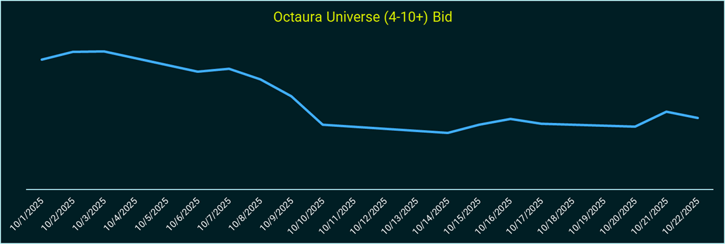
• The weighted average bid of the Morningstar LSTA LLI, since peaking in mid-July, dropped 85 bps in the first two weeks of October, and the share of loans priced at par or higher—a key indicator of investor demand—fell to just 28%, its lowest in over three months, according to an article by Pitchbook.1
• This reset in valuations is driven by broad sectoral weaknesses, notably in chemicals, autos, finance, and technology.
• The Chapter 11 filing by First Brands continues to ripple across CLOs, BDCs, and other funds, amplifying scrutiny around idiosyncratic risk.
• Despite nearly 200 open CLO warehouses, in the beginning of October, buyer caution pushed the share of mids trading above par down from 62% to 47% on Octaura.
• Tariff-induced volatility and macro concerns—like U.S.-China tensions and government shutdown risks—have compounded the uncertainty.
• We’ve seen single name volatility continue to be high across sectors, as well as some retail selling – and prices towards the end of October have rebounded, now back up from early October dips.
Overall, the loan market has seen a sustained bifurcation of performance across sectors on the platform – with some big gains and big losses this month:
• Loans bucketed at mid-level liquidity scores over the last three months have seen the largest losses: Liquidity scores of loans 5,6 and 8, have seen the largest dips in mid-price.
• Conversely, some single name loan items have seen + $3.00 in mid-price over the last three months.
With many market dynamics at play, the quality of execution becomes even more vital. At Octaura, we measure execution quality in how much dealers are improving versus the best level on screens, and how far trades are happening versus the mids – data that you can only access here.
This month, we’ve taken a deeper dive on how this execution quality has differed for our buyers and sellers over time, from the beginning of 2025.
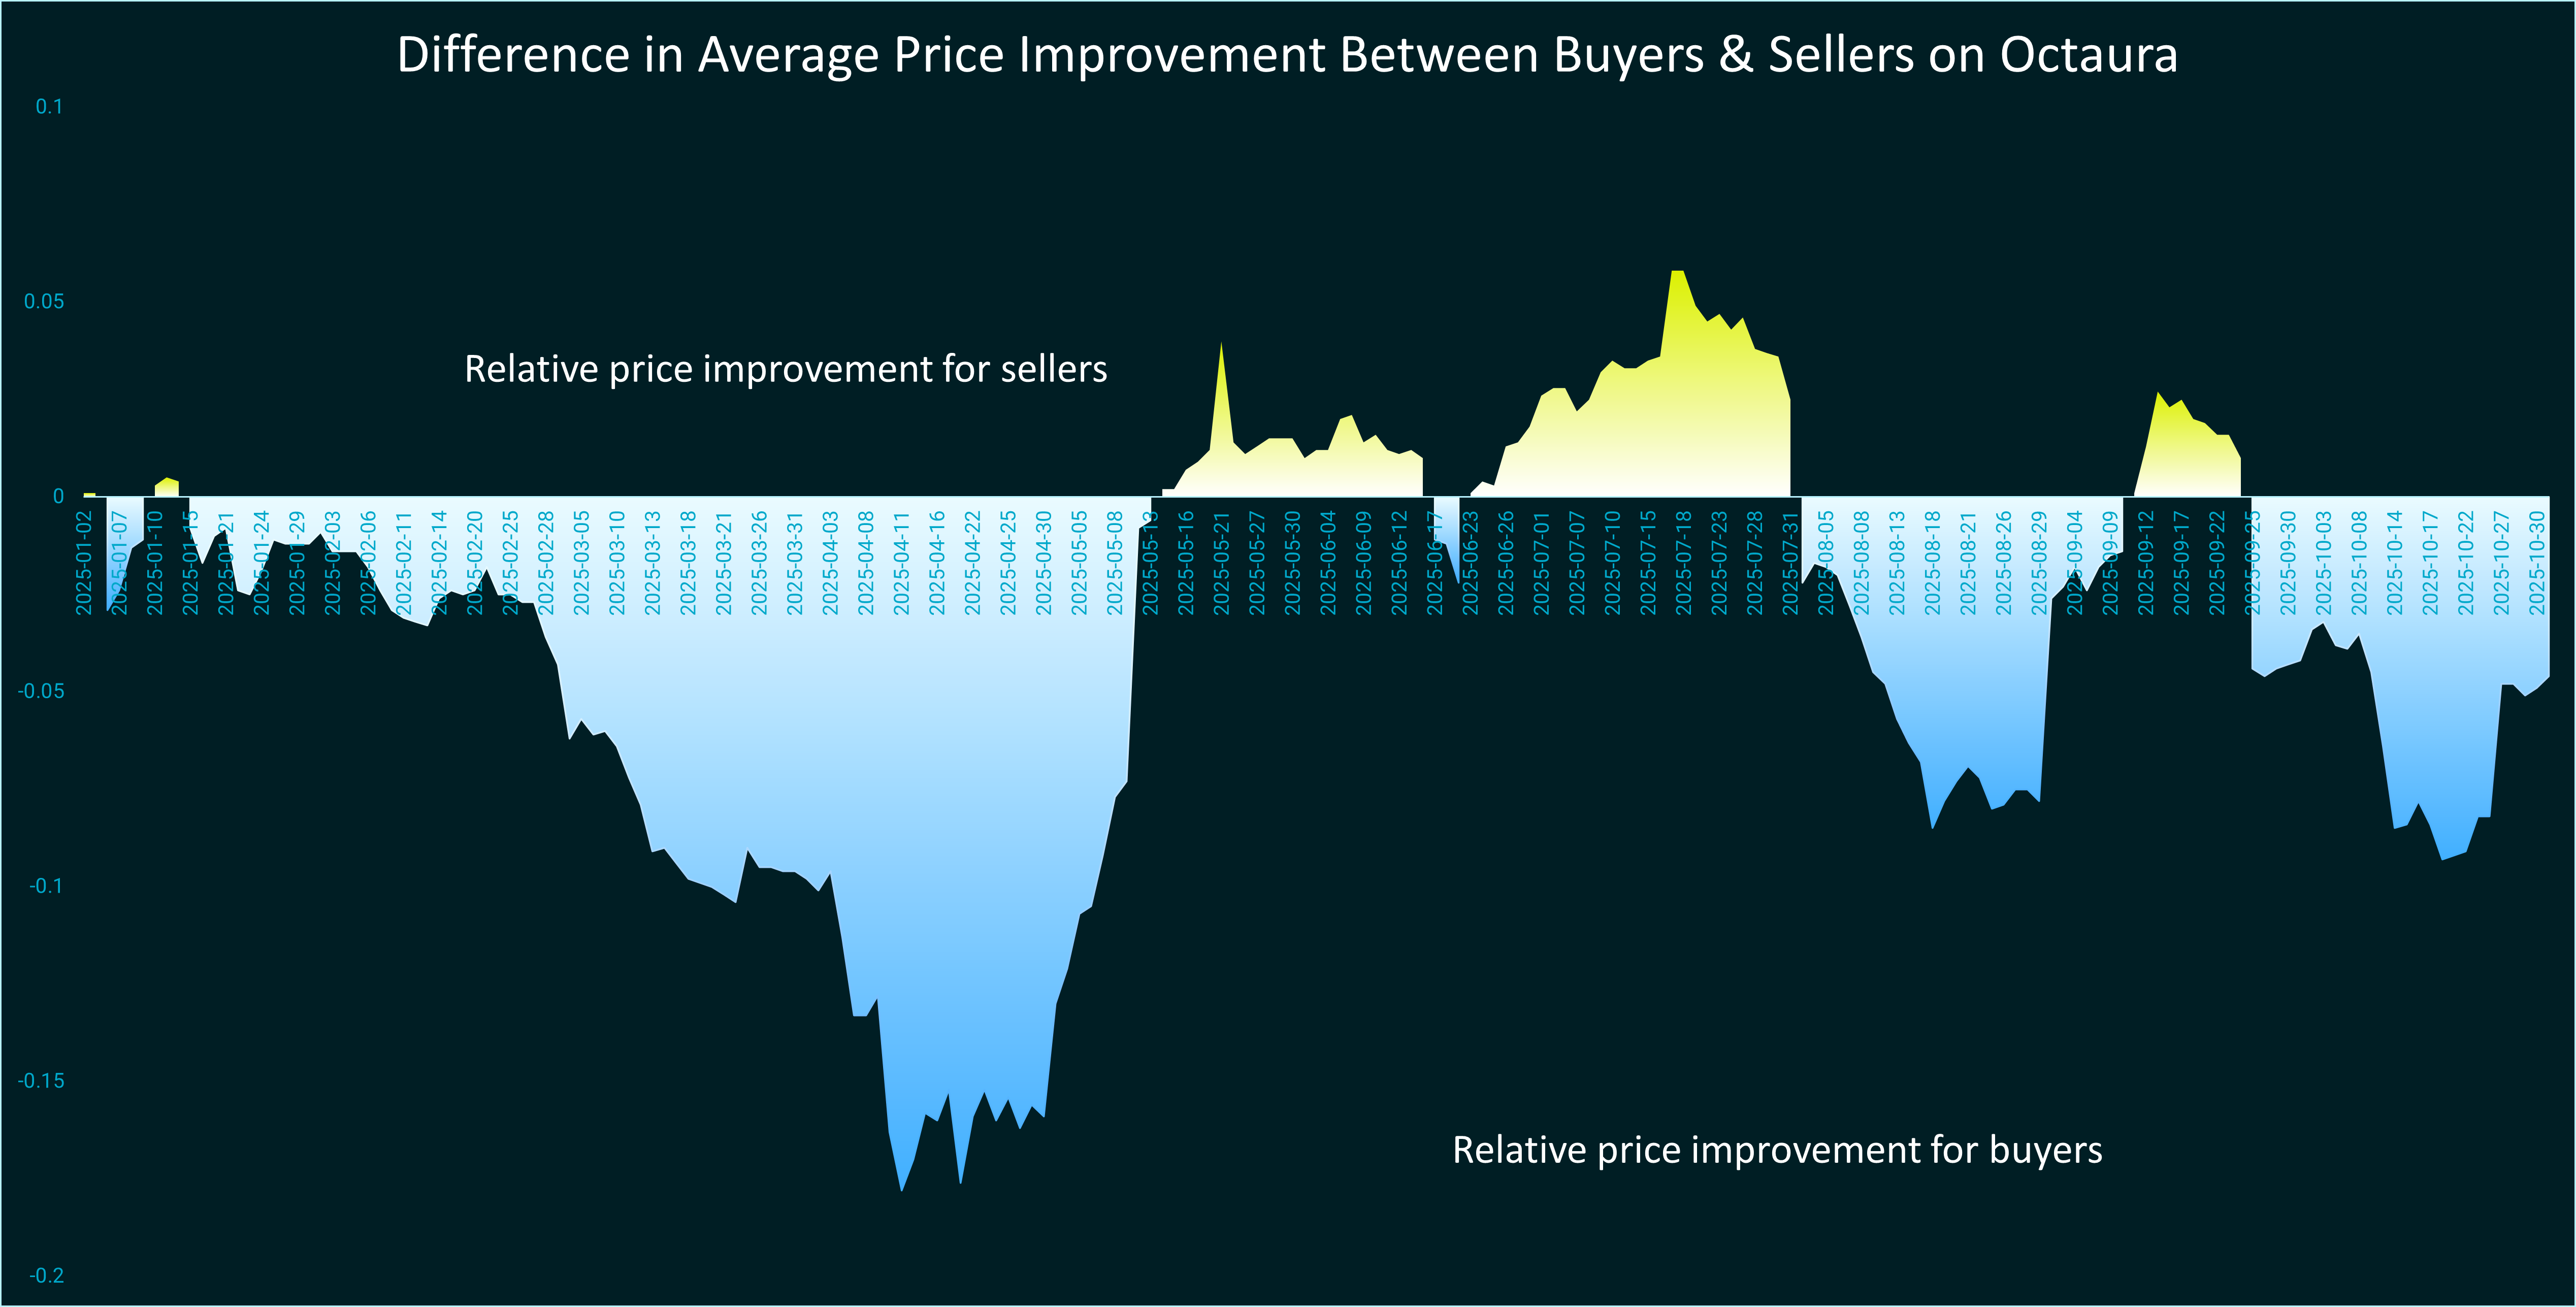
The current, multi-factor environment is favoring buyers on Octaura – with price improvements we haven’t seen since April volatility.
During times of market stress, Octaura can be a trusted venue to source liquidity, increase the opportunity to execute your trades, and access more insightful data, as showcased by Octaura's record performance in October. Last month saw Octaura’s second-highest volume week on record and culminated in a record month by trading volume, with hit rates averaging 84% across protocols.2
Unlock the tools you need to navigate market headwinds.
- Quick Take: Leveraged loans post worst single-day loss since April, Oct 10, 2025 By: Sean Czarnecki
- as of October 31, 2025
All market prices, data and other information (including that which may be derived from third party sources believed to be reliable) are not warranted as to completeness or accuracy and are subject to change without notice. Octaura disclaims any responsibility for any loss or damage arising from any reliance on or the use of this material in any way. The information contained herein is as of the date and time referenced only, and Octaura does not undertake any obligation to update such information. This marketing material is provided by Octaura for informational purposes only. It is not intended as an offer or solicitation for the purchase or sale of any financial instrument. All investments involve risk, and past performance is not indicative of future results.